On Thursday, Wilmette surpassed its prior record of new weekly COVID-19 cases, now over four times the CDC’s red level for community transmission.
District 39’s COVID-19 metrics page is expected to be a resource to accurately inform the public about how the pandemic is affecting our school children. Instead, key charts are distorted, making the situation look less concerning to the average reader.
There are many well-documented methods to mislead the reader using charts. One approach is to manipulate the Y-axis in order to convey a situation that can appear more favorable.
On first glance at the left chart below as it is displayed on the district's site, it appears as if case counts doubled this week. In fact, if you look closely at the black-on-blue text, you will notice that cases have increased more than fourfold to 29. But notice that the top line of the chart is clipped to only 14 cases, underrepresenting the true value by more than half.
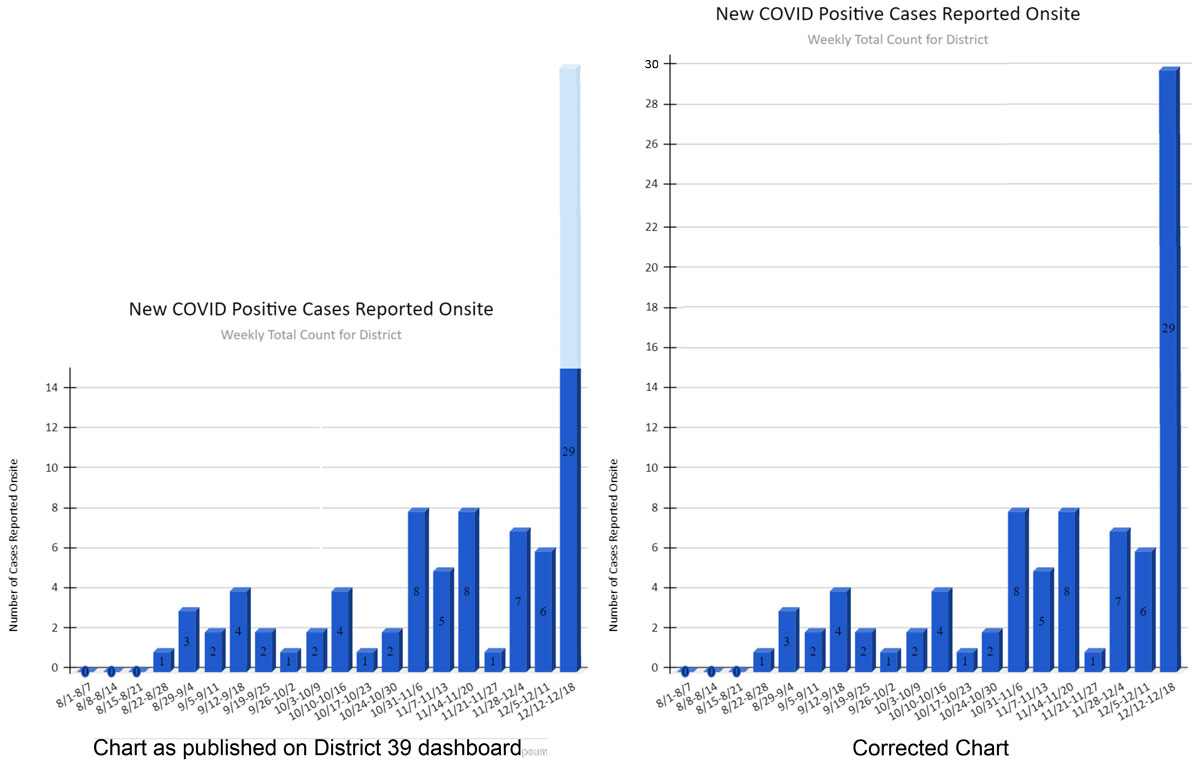
Per standardized methods of measuring misleading charts, this chart’s "lie factor" is 2.1, where a score of 1.0 means that the chart accurately represents the data. The “effect size” of the lie is 0.5, indicating that there is a substantial obscuring.
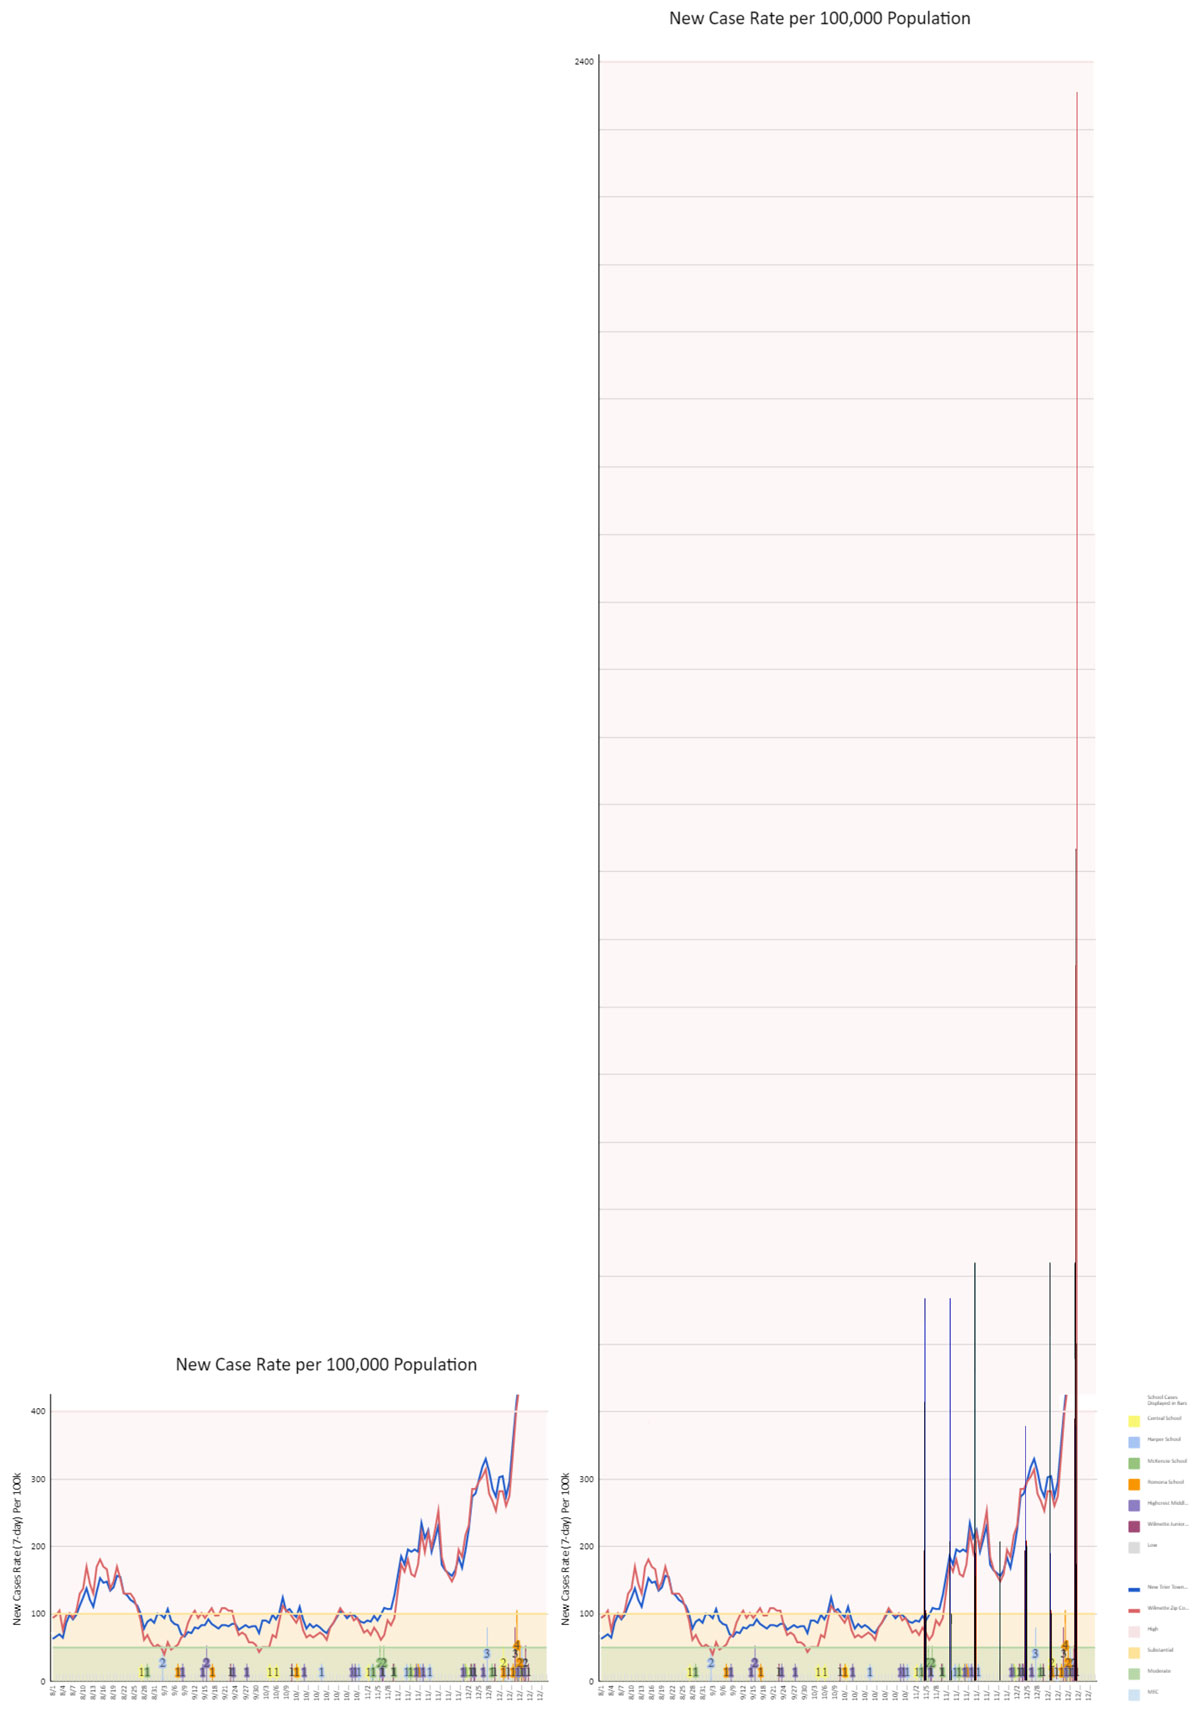
The second chart, shown below on the left as published, is even more misleading. It compares the case rate of our local schools to that of the community. The chart is titled “New Case Rate per 100,000 Population,” which indicates that the data is scaled uniformly per CDC standards, for an apples-to-apples comparison of case rates. The problem is that the community levels are adjusted accordingly, but the school levels are not, showing far lower than the correct counts. The colorful spikes at the bottom of the chart are the underreported school cases, and the red and blue lines are community levels.
If the school counts were represented as professed by the chart’s title, Romona school's weekly case rate, based on the school's 642 students and staff, should be 1,402 weekly cases per 100k. This correctly represents that the case rate at the school is alarmingly higher than the level in the surrounding community, over 14 times the rate for a CDC red hotspot. This is way off of the chart that, as published, tops out at 400. For the Mikaelian Education Center (MEC) spike, the correct chart value is almost 2,400 cases per 100k.
The below chart on the right illustrates what the chart would look like if schools were correctly scaled. Parents and school staff might be alarmed to see that many of the schools have been exceeding community levels since the start of November*, and dramatically so this week. Per standardized methods of measuring misleading charts, this chart’s "lie factor" for Romona school is about .25, and 0.01 for the MEC, which indicates an additional 50 times more obscuring of the data.
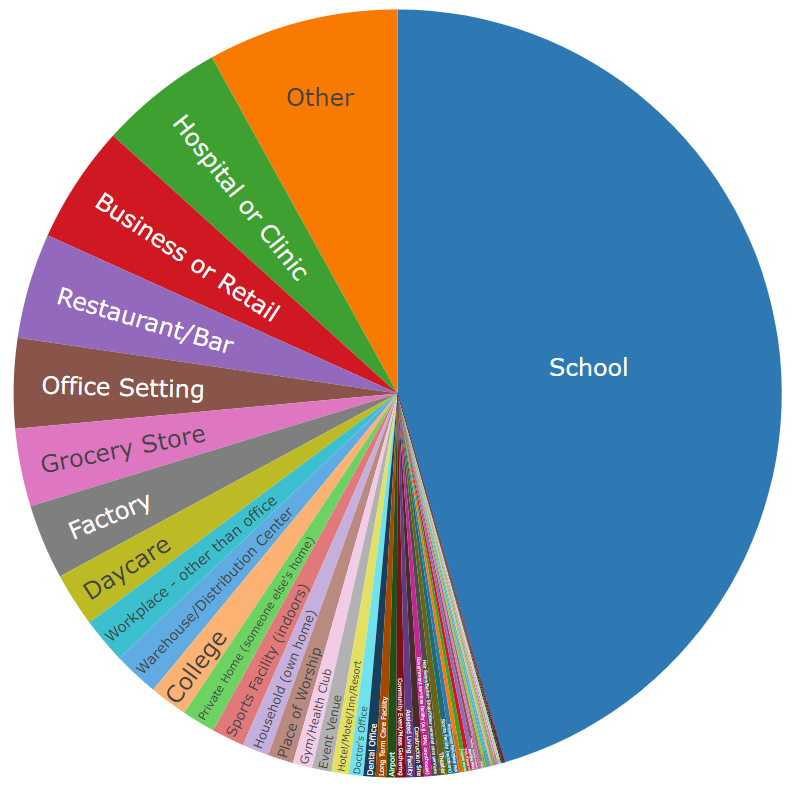
Last Thursday, the Illinois Department of Public Health updated their potential exposure location data which reports that schools are almost as likely as all other locations combined, or 45.6% of the cases. This is one of the highest rates recorded during the pandemic.
District 39 Superintendent Kari Cremascoli did not respond to multiple requests for comment.
* only school cases after 10/31 are scaled in the right-hand chart because the district only published the weekly school counts on the dashboard starting on this date.
Add new comment